The Energy Between People
| The Energy Between People | |
|---|---|
| Name | The Energy Between People |
| Location | De Bonte Zwaan |
| Date | 2018/07/23-2018/07/24 |
| Time | 10:00-17:00 |
| PeopleOrganisations | Jo Caimo |
| Type | HDSA2018 |
| Web | Yes |
| No | |
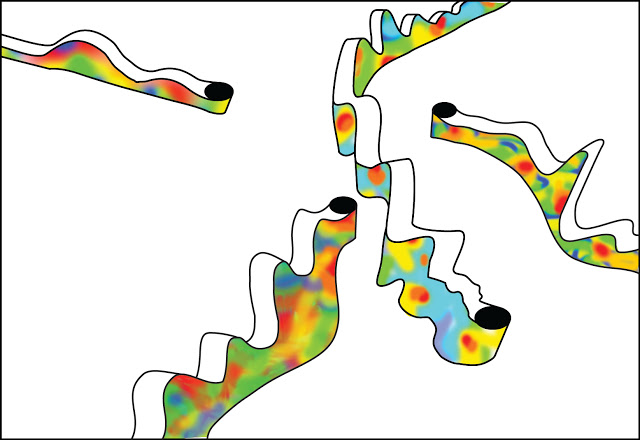
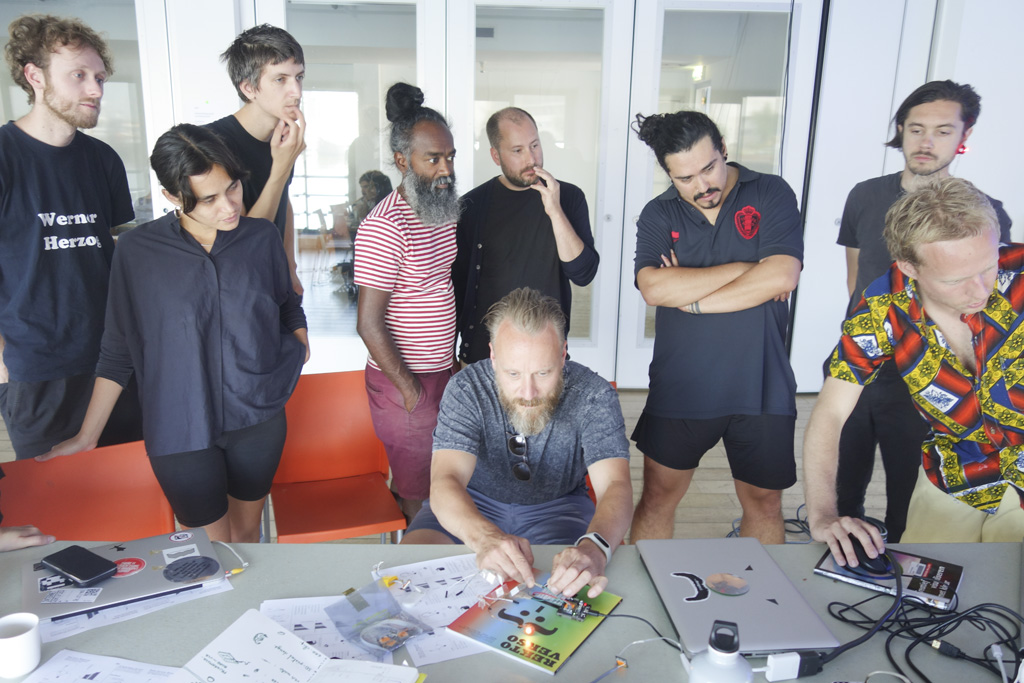
Jo Caimo and Jorge Guevara shared with the rest of the participants their attempt to measure man's enthusiasm. Together we searched for algorithms to visualize the energies between people.
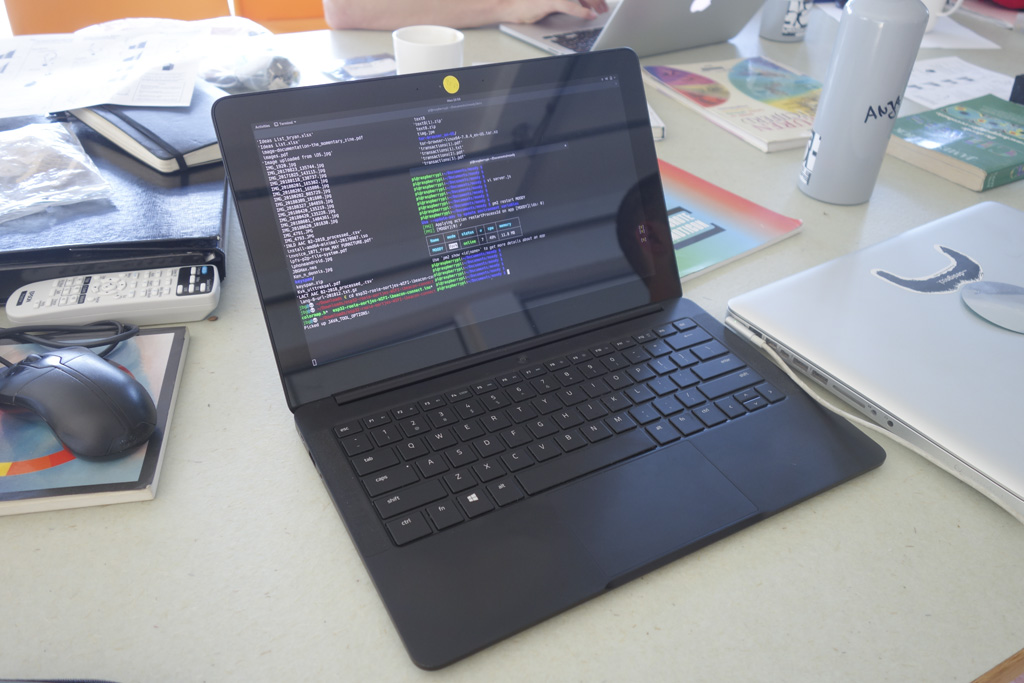
The workshop was a combination of proposing the project, the making and designing of the devices, a conversation about color theory, attractiveness and repulsion forces and the question of how to visualize energies. We worked with temperature sensors, esp32s, rgb-leds, arduino software, RaspberryPi as a recipient of all data, ibeacon's and the data visualization with d3.js or other tools to make amorphous colorful moving forms: the energy between people.
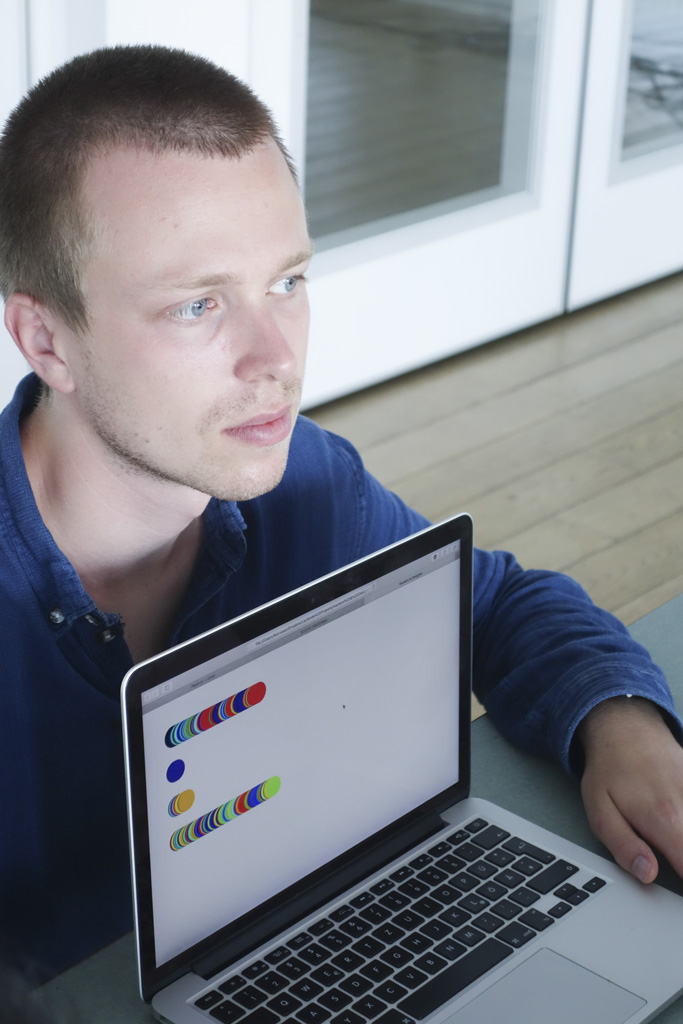
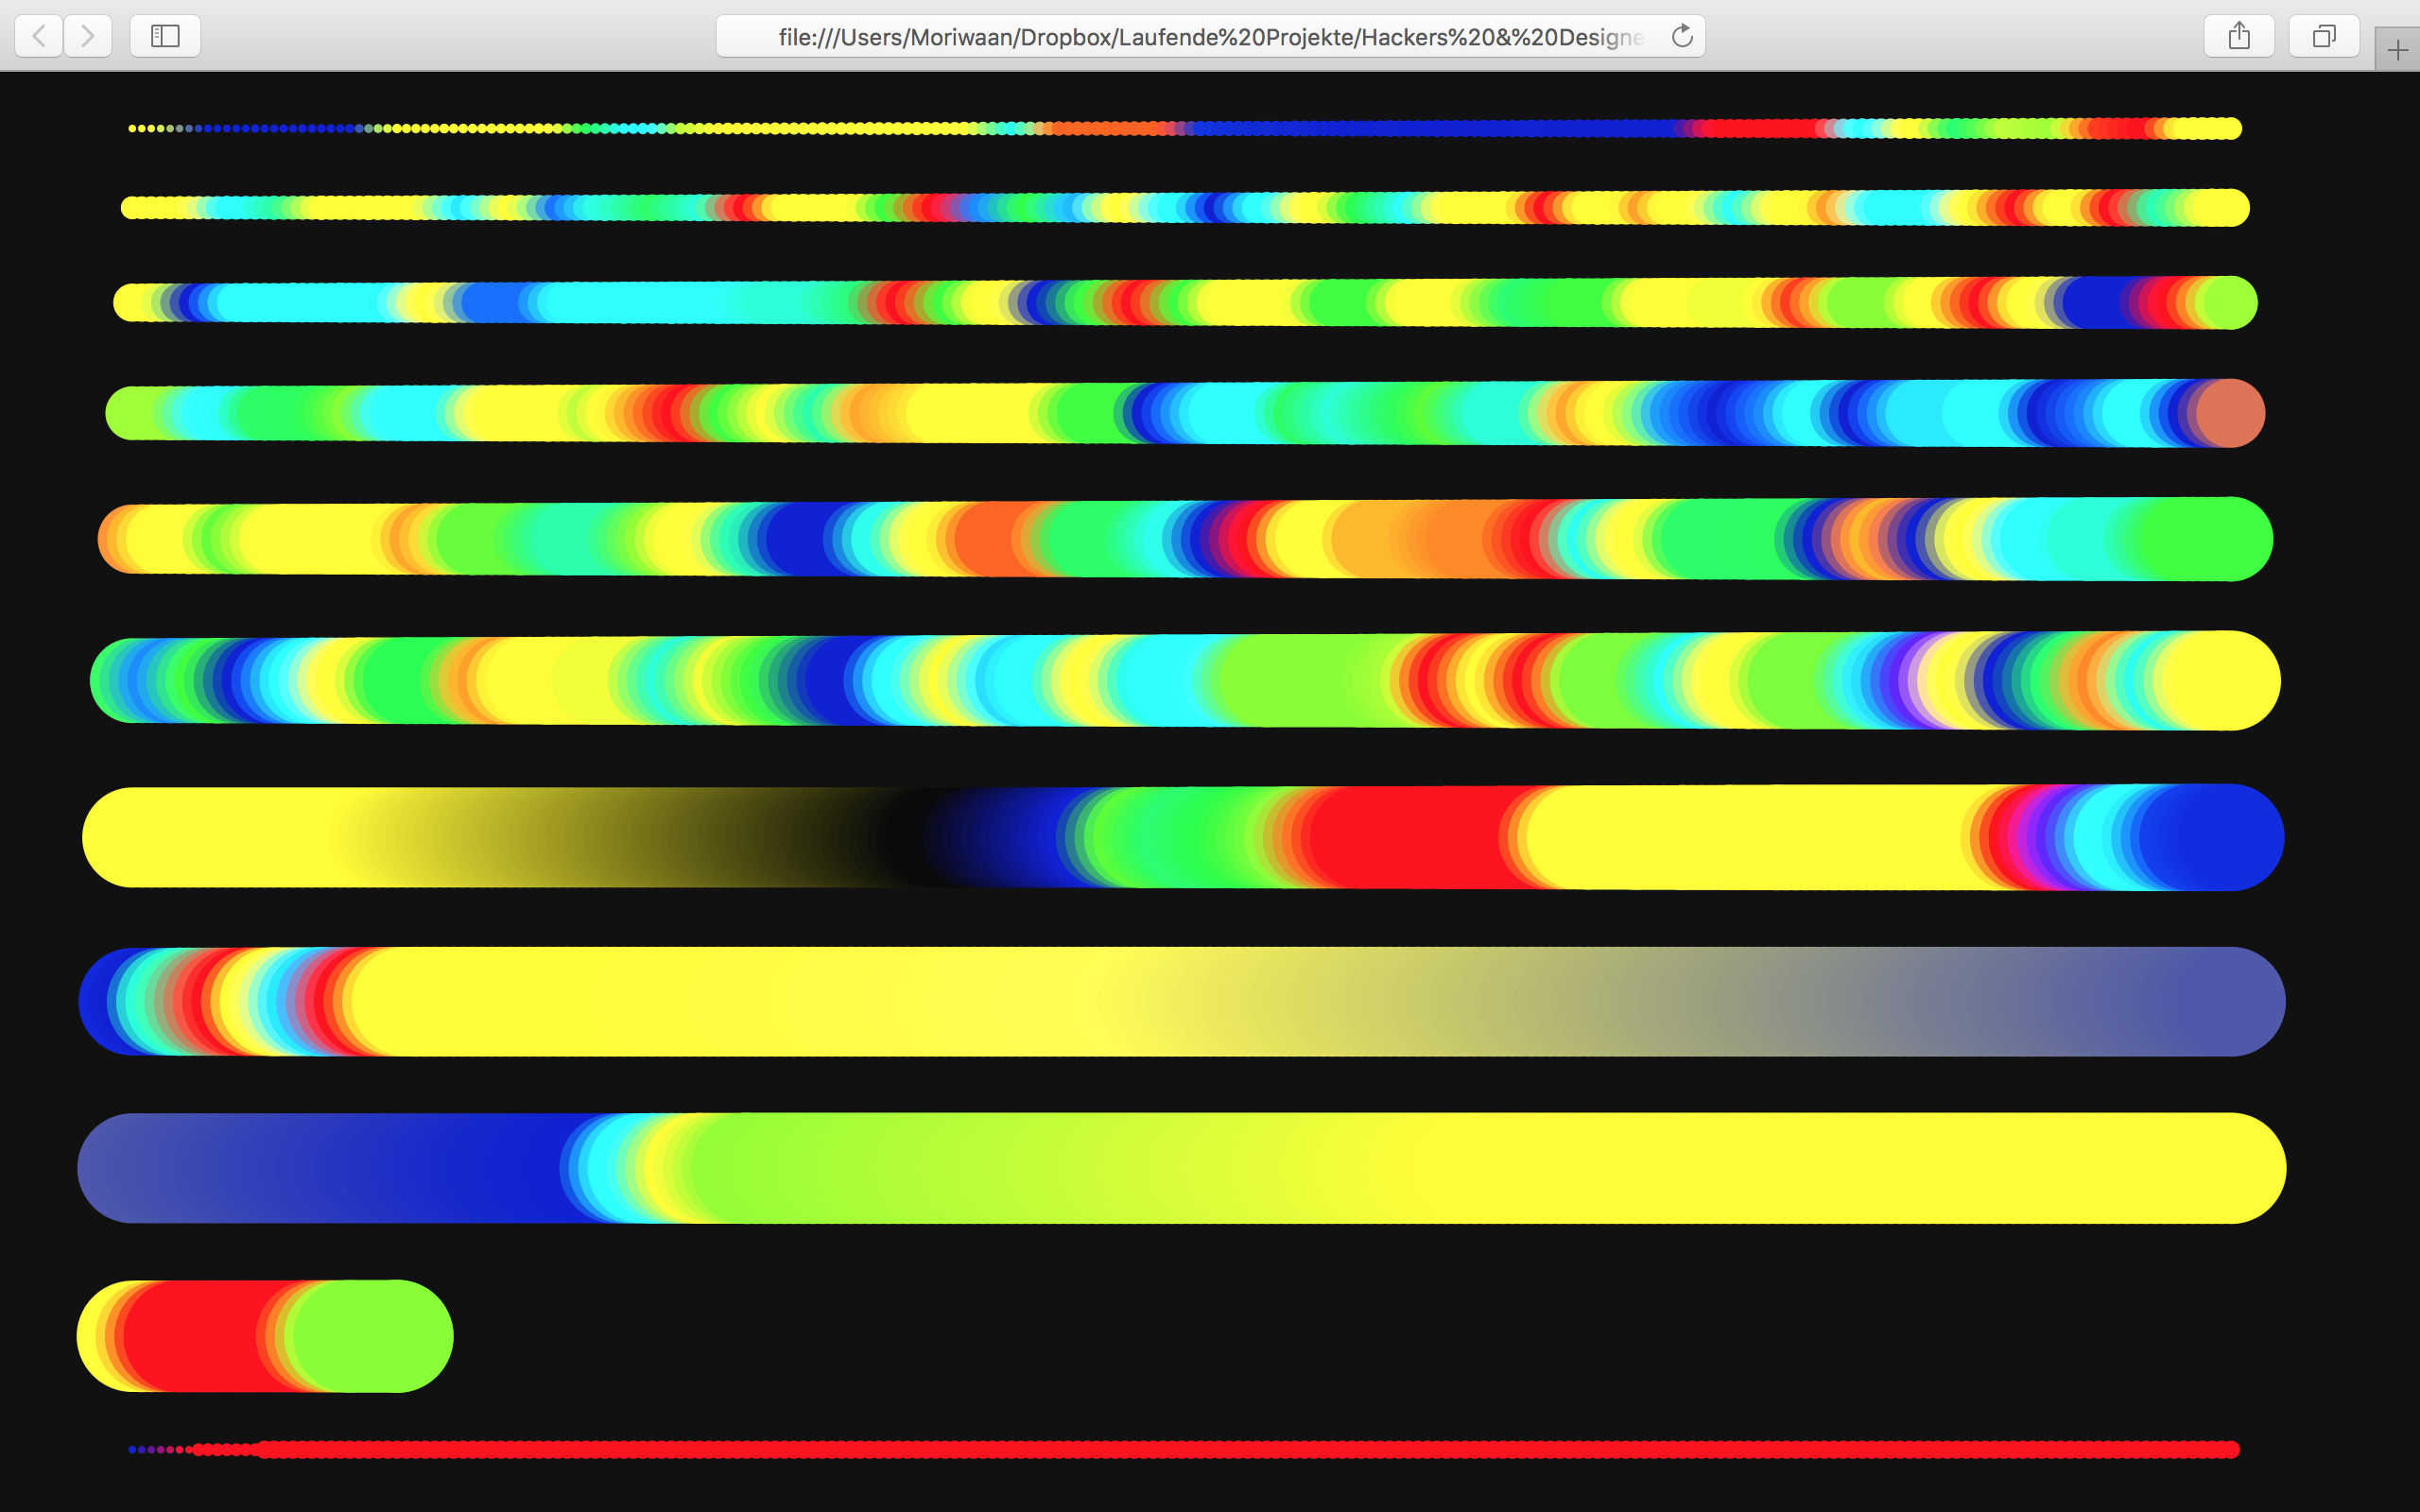
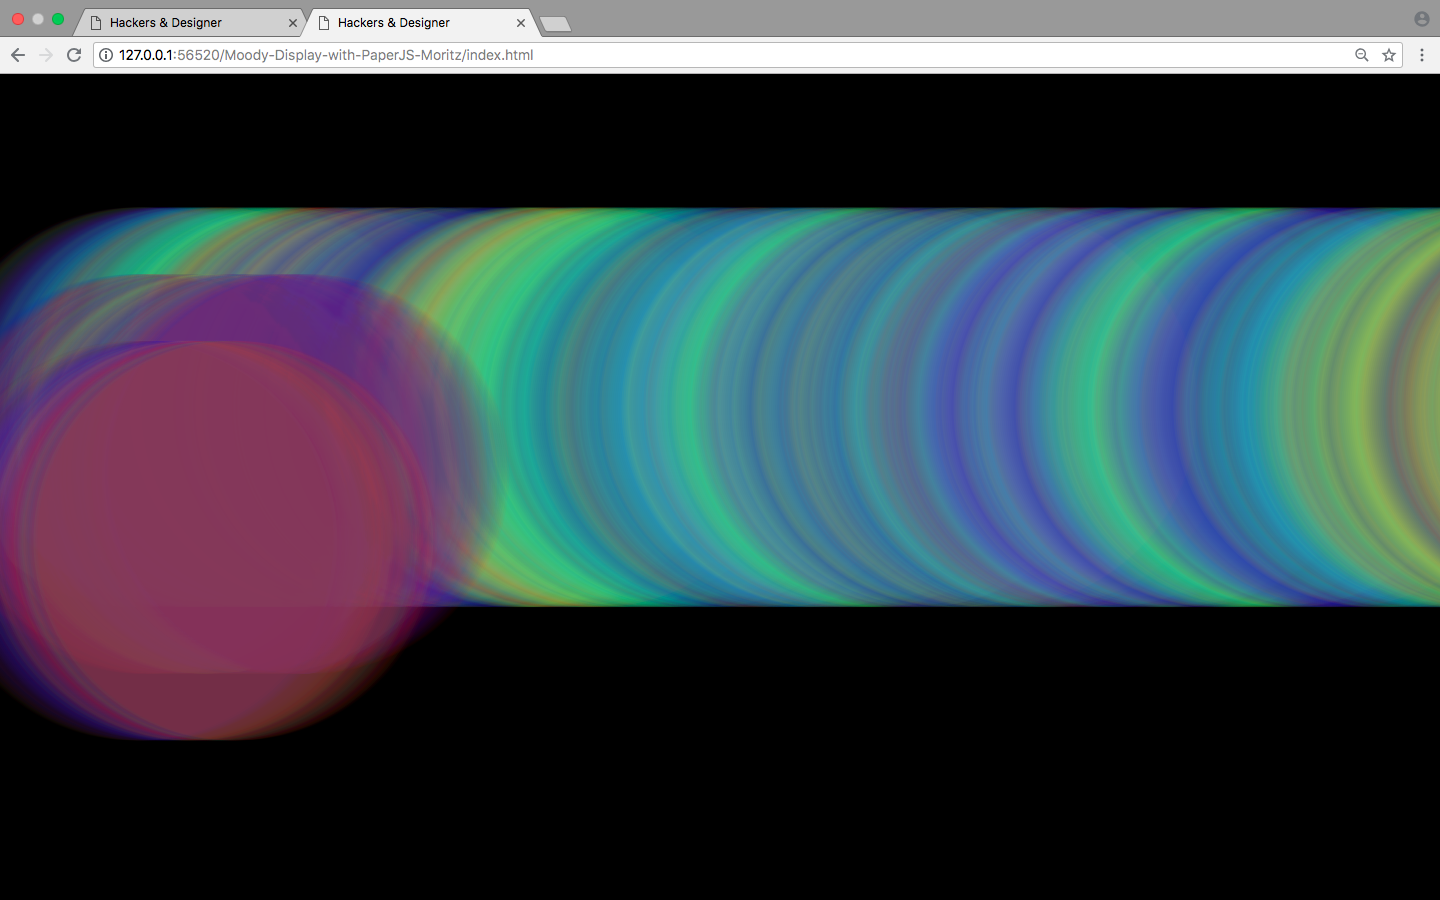
Moritz made a visualisation of each color/mood as circles and kept track of the stages in-between one mood to another. The code he wrote enables visualisation of several devices at the same time, the older the data is the smaller it gets.
Jorge used Moritz code to play with transparency and superposition of the different stages.
André and Marcel worked on a sound translation of the moods.
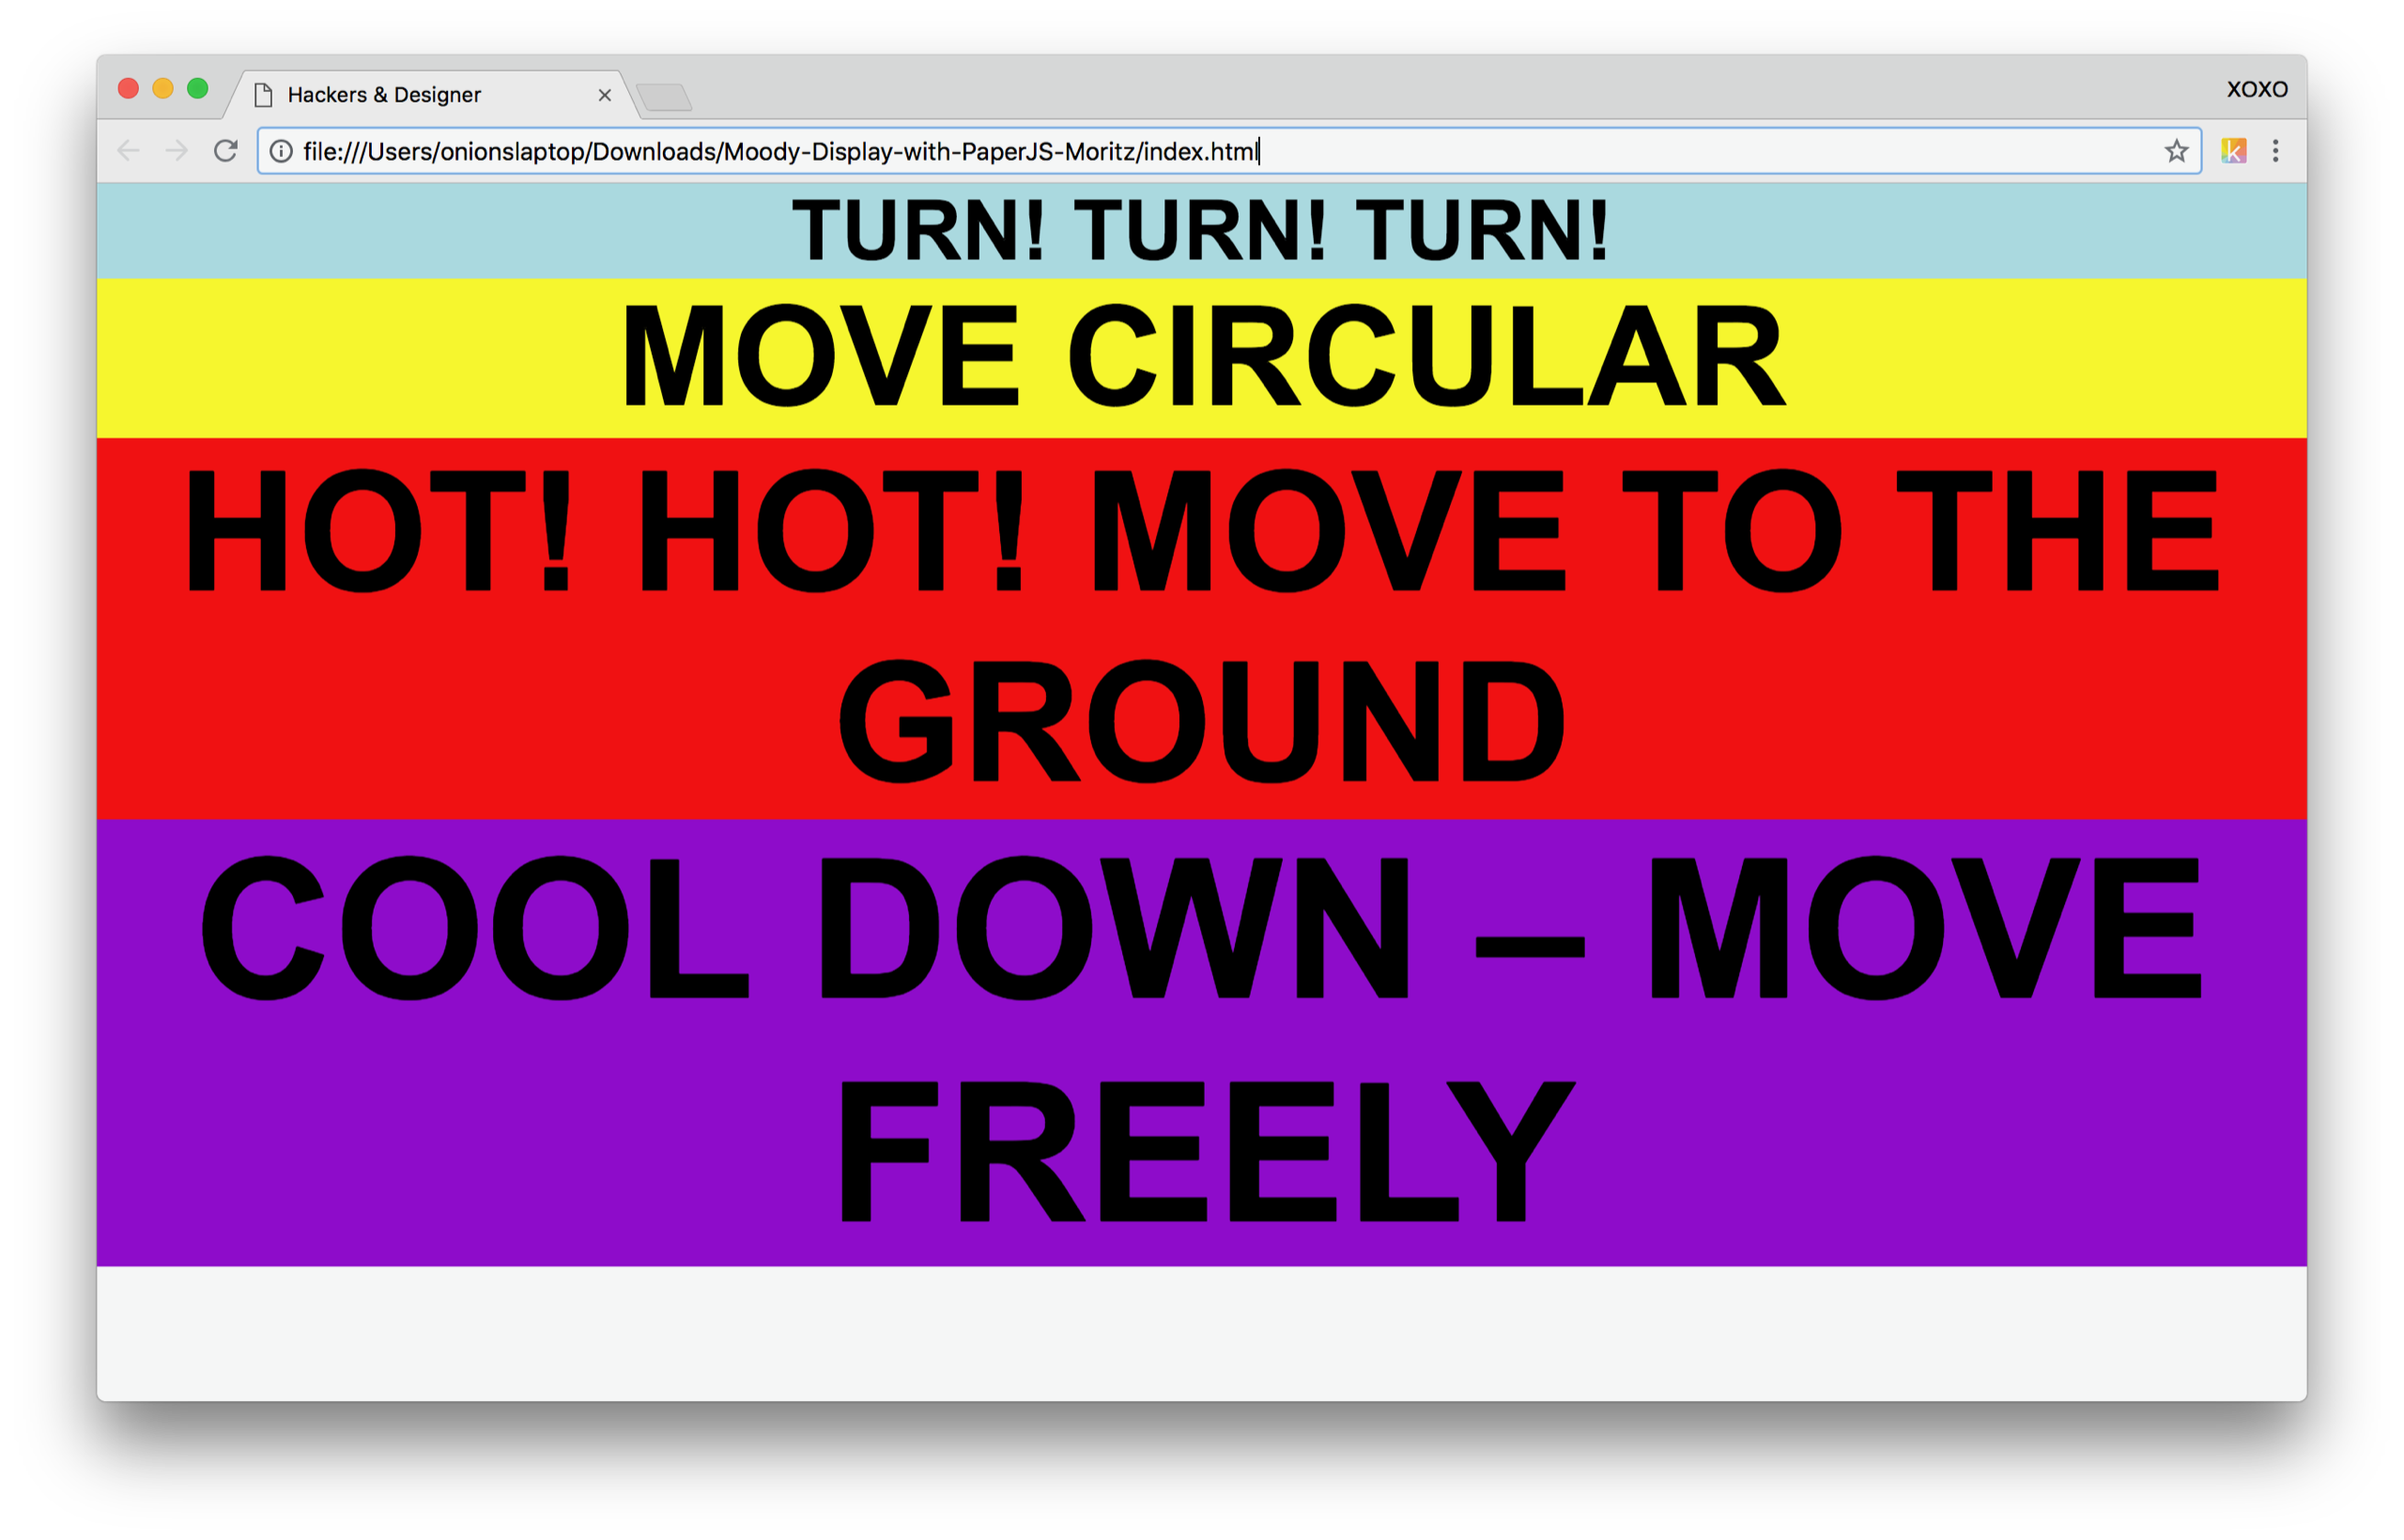
Anja and Selby developed a text based visualisation that gives choreographic instructions that changes your mood!
Heerko made a program to gather the last data of multiple devices at once and get the computer to translate it with words.
James made everything possible for everyone to play around and also managed to make his keyboard (which can have different coloured back light) the visualisation of the energy between people.
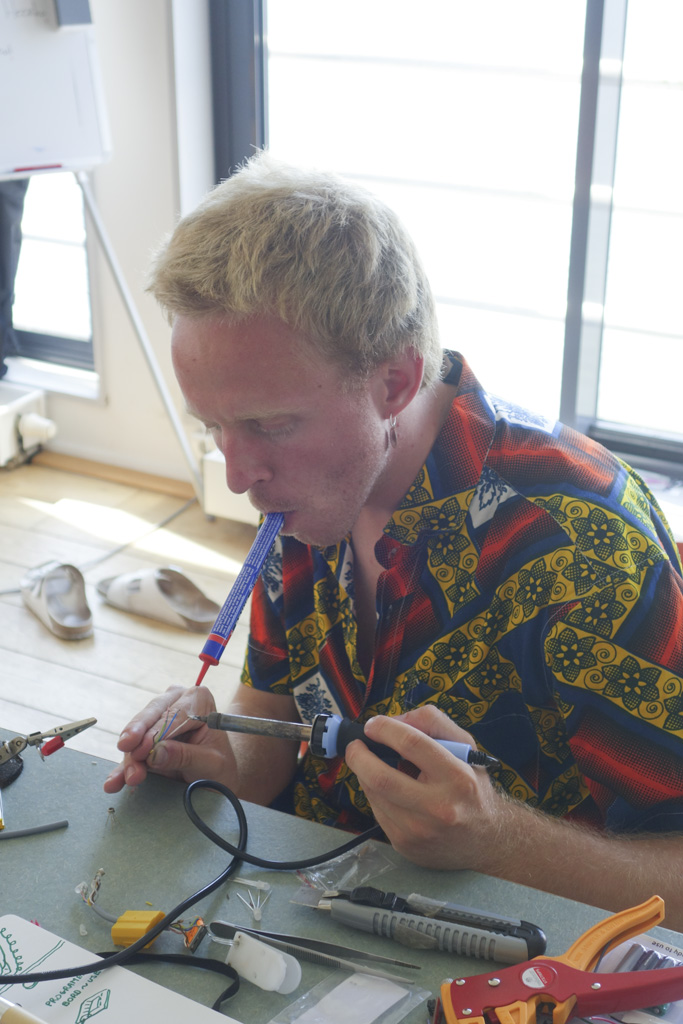
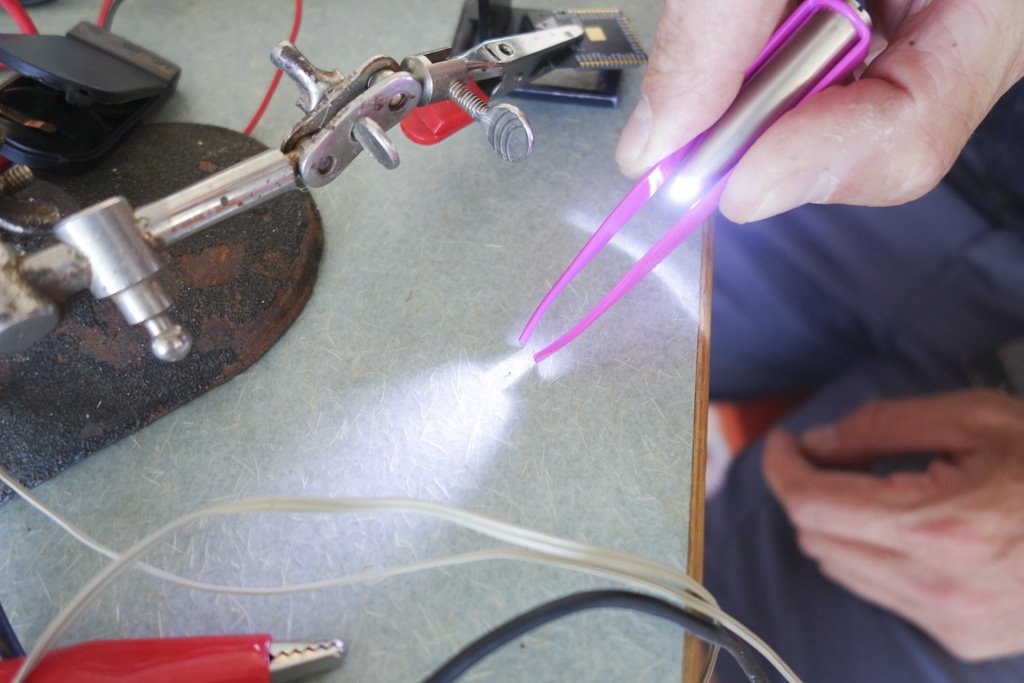
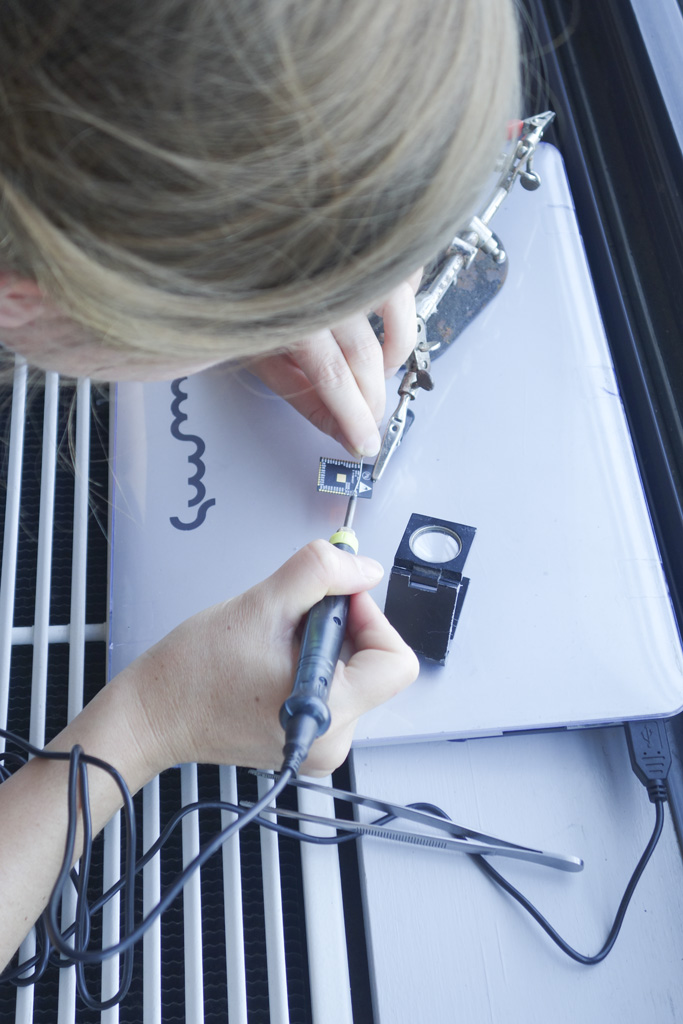
Antonin and Jo soldered the devices together to have as many working devices as possible.
Read more on the Research on Jo's blog.
<eplite src="https://etherpad.hackersanddesigners.nl/p/" id="penergy" />
